Streamlining Hierarchical data representation
I led the design of Ted from 0-1, from researching, identifying problems, to designing and handing off for implementation. Ted
Features such as initiating open enrollment setup have already shipped to 350+ external benefits brokers, impacting a total of 40,000+ internal and external users.
Role
Product design lead
Duration
1 Month
Team
Kate Davies
Technical Lead

Kate Davies
Principal Product Designer
Kate Davies
Product Owner
Kate Davies
Designer
Kate Davies
Designer
Kate Davies
Designer
Context
Ted is a robust platform designed to seamlessly ingest data from diverse third-party sources, catering to product owners, data architects, and desk analysts. Its primary objective is to consolidate data across multiple pipelines, establishing a definitive system of truth accessible to all stakeholders. By harmonizing disparate data streams, Ted empowers users with comprehensive and reliable insights, fostering informed decision-making and enhancing operational efficiency
Problem
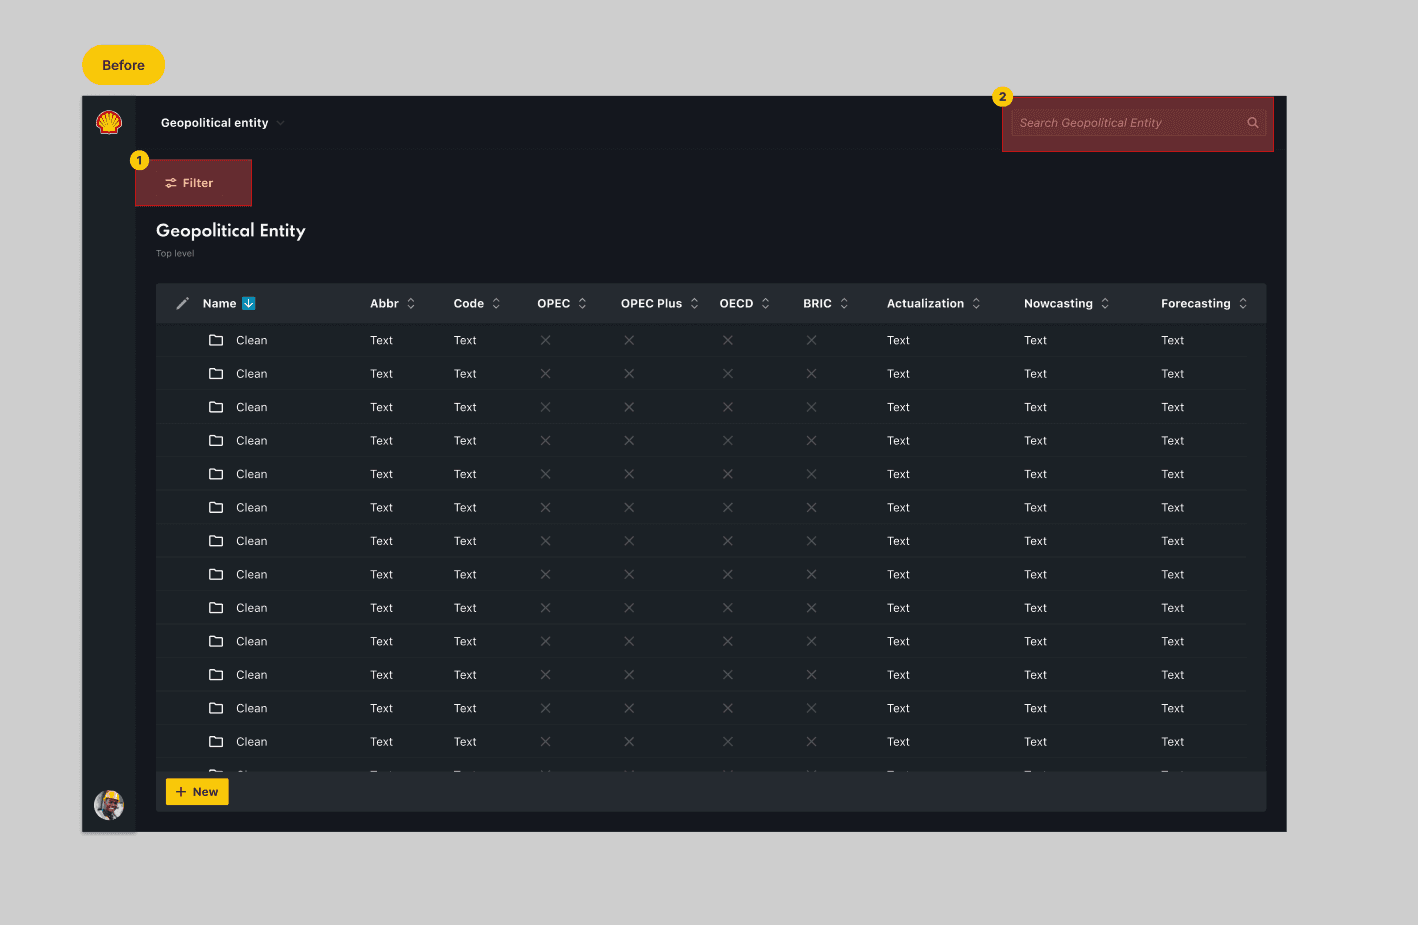
Our current system presents a significant challenge for users attempting to navigate through hierarchical data. The issue arises when users explore various groups of data, only to find that no providers are visible due to the consolidation of providers at the lowest hierarchy level.
This problem stems from the lack of clarity in data representation, hindering users from effectively comprehending the relationships and attributes within the system. Users struggle to grasp the hierarchy's nuances, which affects their ability to make informed decisions and identify key insights.
Furthermore, the existing hierarchy lacks consistency in column attributes across different levels, leading to confusion and inefficiencies in data interpretation. Users find it difficult to differentiate between geopolitical entities and materials due to inadequate column alignment.
1
There were no filters and no clear way to navigate the large data volums which means users had to click through the many layers of data to find information
2
Search was only limited to Geopolitical entities, which meant if you searched for material entities, you'd reach a dead end. 404
Goal
Better integrate brokers into Gusto so they can work faster, better serve their clients, and make them happy and healthy.
Success Metrics
the percentage of users who actively engage with the platform after its launch. Higher adoption rates indicate successful onboarding and acceptance of the platform among stakeholders.
1
User adoption rate
decrease in the number of support requests or inquiries related to data access, navigation, or functionality. A reduction in support requests indicates improved usability and self-service capabilities.
2
Reduced support requests
data quality metrics, such as accuracy, completeness, and consistency across different sources and reports
3
Data accuracy and consistency
Reduced time spent on data retrieval indicates increased efficiency and productivity.
4
Time saved in data retrieval
Solution
Ted was redesigned to

1
Title
1
Title
1
Title
1
Title
Design Decision 1: Dashboard
In order to prioritize what features would create the most value in the shortest amount of time, I worked with PM, research, eng, and product ops to strategize a plan for MVP release. We ultimately decided to tackle two workflows that dominate the majority of a broker’s work: employee tasks and open enrollment.

Design Decision 2: Dashboard
In order to prioritize what features would create the most value in the shortest amount of time, I worked with PM, research, eng, and product ops to strategize a plan for MVP release. We ultimately decided to tackle two workflows that dominate the majority of a broker’s work: employee tasks and open enrollment.

Design Decision 3: Dashboard
In order to prioritize what features would create the most value in the shortest amount of time, I worked with PM, research, eng, and product ops to strategize a plan for MVP release. We ultimately decided to tackle two workflows that dominate the majority of a broker’s work: employee tasks and open enrollment.

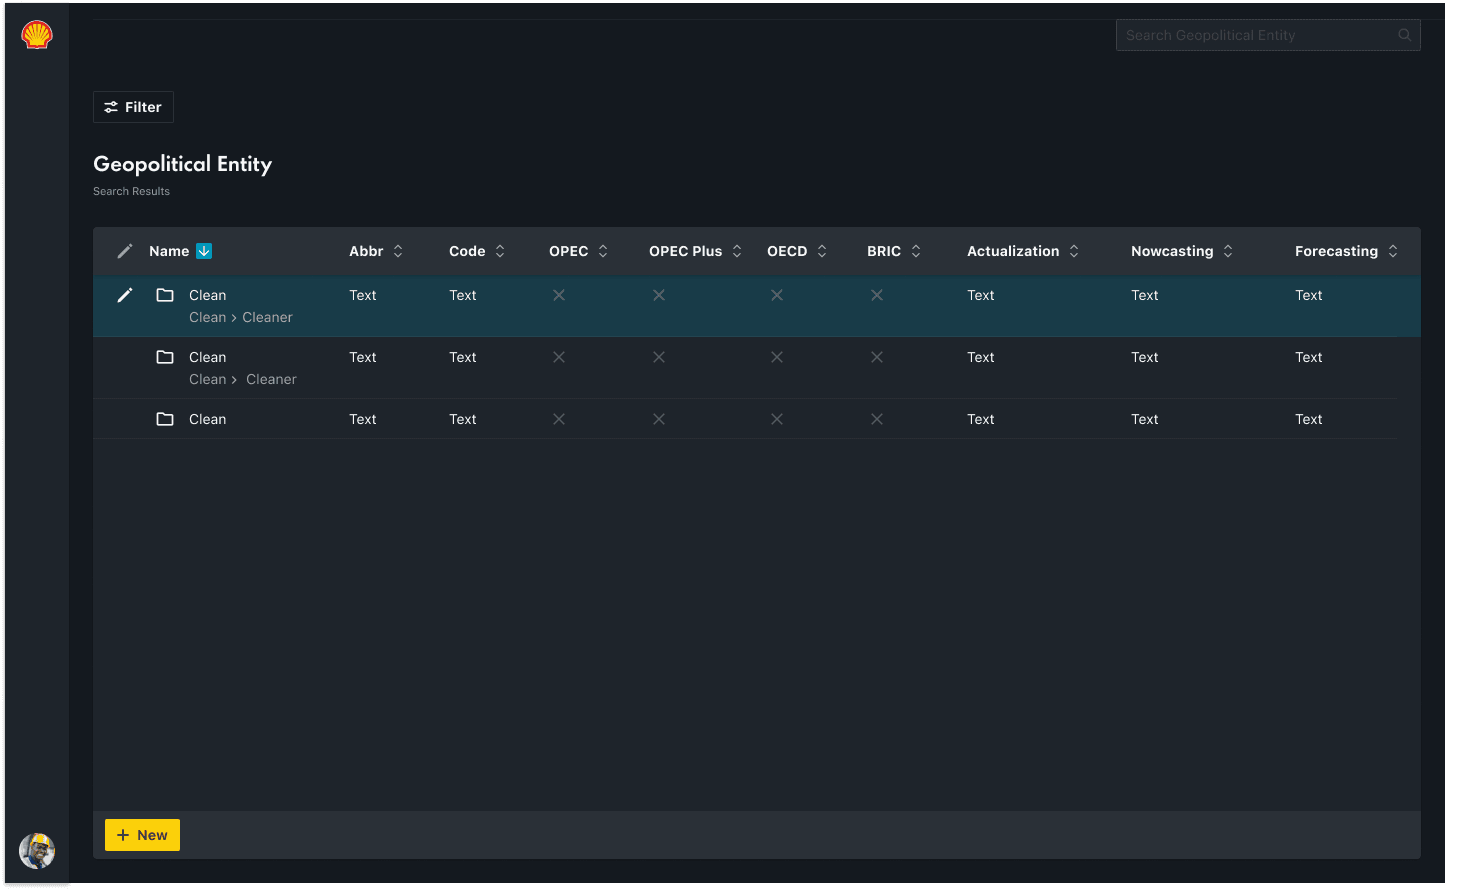
Final Design: Broker View
Brokers can now view, manage, and complete benefits tasks for all of their clients in their own dedicated tool. The first MVP includes features that allow them to work on employee tasks and open enrollment across all of their clients.
Final Design: Open Enrollment Setup
Brokers can now view, manage, and complete benefits tasks for all of their clients in their own dedicated tool. The first MVP includes features that allow them to work on employee tasks and open enrollment across all of their clients.
Final Design: Broker View
Brokers can now view, manage, and complete benefits tasks for all of their clients in their own dedicated tool. The first MVP includes features that allow them to work on employee tasks and open enrollment across all of their clients.
Design Handoff
Brokers can now view, manage, and complete benefits tasks for all of their clients in their own dedicated tool. The first MVP includes features that allow them to work on employee tasks and open enrollment across all of their clients.
Outcomes
Test
1
Test
Description
2
Title
Description
4
Title
Takeaways
Brokers can now view, manage, and complete benefits tasks for all of their clients in their own dedicated tool. The first MVP includes features that allow them to work on employee tasks and open enrollment across all of their clients.